Tag: capital growth

1st February 2016

Crawley v’s Redhill: Investment Property – Not Football !

One of our landlords called up the other day looking to invest in another flat. Flats are his thing rather than houses and he already has investment properties in both Redhill & Crawley. He’d seen a few flats for sale in both towns and was asking our advice as to which location we thought would be better.

This got us thinking about both capital growth & rental yields in both towns. So we decided to take a closer look by comparing roughly similar types of properties in both locations, to see which one was the “best”.

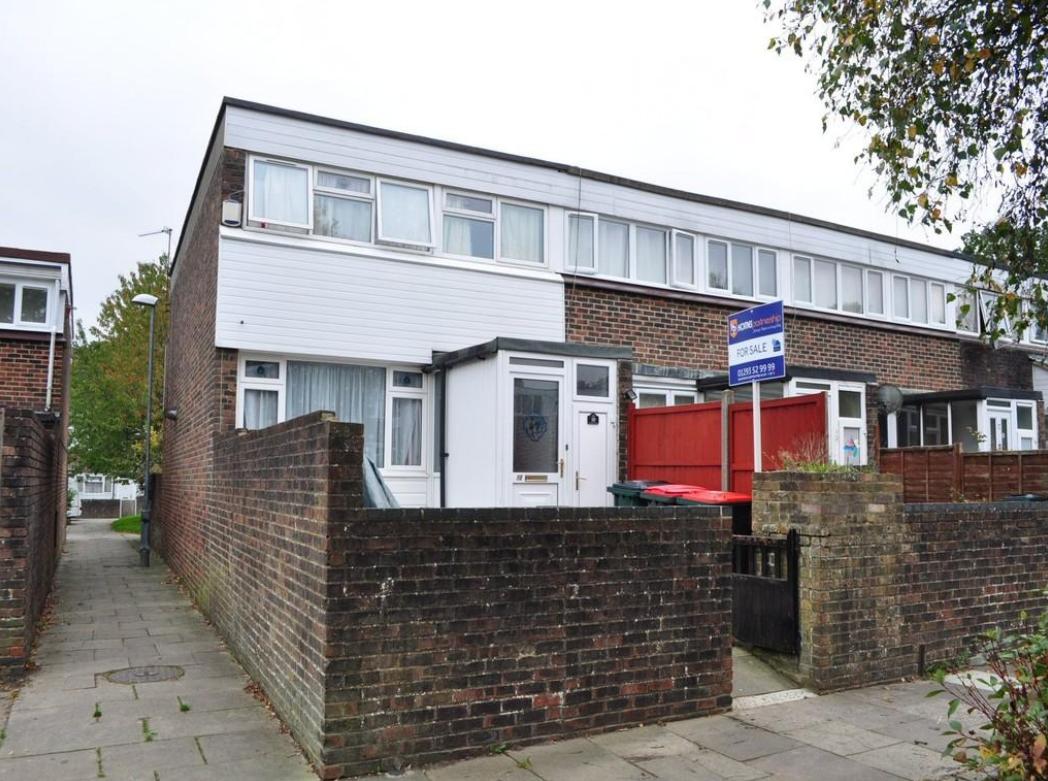
Crawley people will be familiar with the Maidenbower flats at Fenchurch Road, Lyon Close and Dakin Close, while those from Redhill will be familiar with the “St Anne’s” development. Both locations are fairly convenient for their respective town centres and mainline stations to & from London. As such, the flats were and remain very popular with both tenants & landlords alike.

In order to compare the two locations we have used price paid information from HM Land Registry. Historic rental prices, as advertised on Rightmove & Zoopla, were used to calculate rental yields. In Table 1 we show the average prices and capital growth percentages for the flats in Redhill & Crawley over the last 15 years.

Table1: Average prices & capital growth

Table1  1-2-16

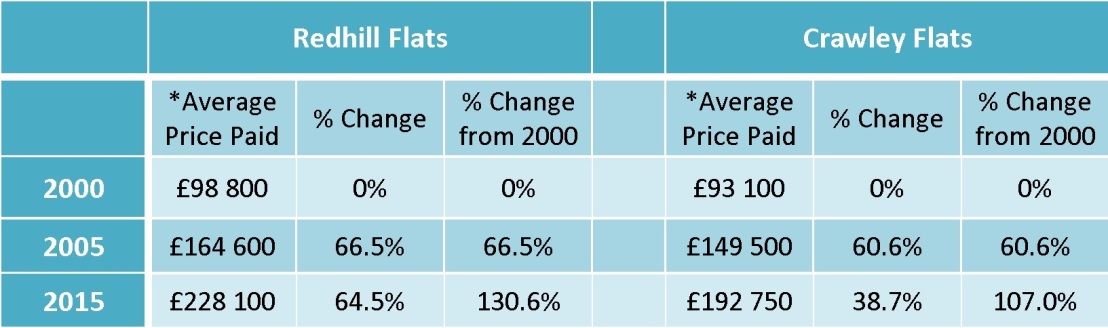
* Calculated from Land Registry price paid data

Prices in 2000 were roughly the same for both locations, give or take just under £6k. However, average prices for the Redhill flats have increased by 130% over the last 15 years, giving a year on year average compound rate of increase of around 5.74%. This can be compared with Crawley where there has been a corresponding overall increase of 107%, or an average compound rate of increase of 4.97%, year on year. In monetary terms the average Redhill flats have increased by about £129300 over the last 15 years, whereas an average Crawley flat has “only” managed an increase of £99650 i.e. a difference of nearly £30k !

However, as we’ve previously mentioned before in these blog articles, there are two sides to every story and property investment is no exception. For property investment, the flip side to capital growth is rental yield i.e. how many pounds we get back in rent for each pound we invest. Areas with higher rental yields tend to come with lower capital growth and vice-versa. However, combine both and you get a much fuller picture of how well a particular investment is performing.

The investment strategy of the landlord who prompted this article is fairly well balanced between capital growth on the one hand & rental income on the other. In a perfect world he’s happy to sacrifice some capital growth for rental income, so that his investments cover running costs and provide some additional income on top. His running costs include a float for the inevitable breakdowns & repairs, as well as money for refurbishing his properties every 4 to 6 years to keep them fresh & up to date.

So on the face of it, investing in the Redhill flats is a better option in terms of Capital Growth than Crawley. However, what about Rental Yield ?

In Table 2 we show average gross rental yields over the last 10 years for the Crawley & Redhill flats in question.

Table 2: Average Gross Rental Yields

Table2  1-2-16

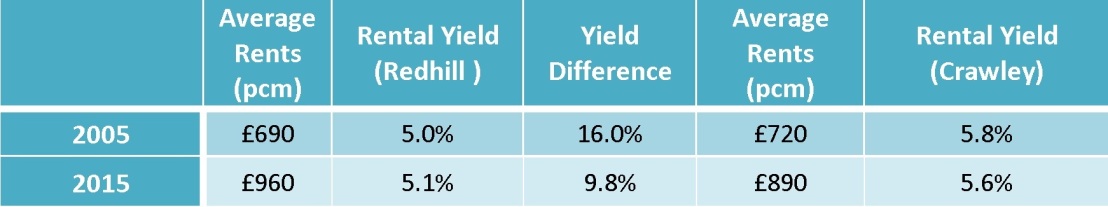
The figures in Table 2 show that on average the Redhill flats have a lower average gross rental yield compared with those in Crawley. Over the last 10 years, the difference in yields, shown in the middle column, vary from 9.8% to 16.0%. Another way to interpret this difference is that for every pound you invested in the Crawley flats, you get between 9.8% & 16% more back in rent.

So although the Redhill flats outperform Crawley in terms of Capital Growth, Crawley is clearly the winner when it comes to Rental Yield. Deciding on whether Crawley or Redhill are “best” for you will depend on your investment strategy….. is it driven by income or long term capital growth ?

As far as our landlord is concerned, he’s gone away to think over his investment strategy. His considerations are now whether to change the balance of his portfolio to give higher rental income (i.e. higher yield), sacrifice some of the income for longer term capital growth or stay as he is. We’ll keep you posted on what he decides to do !

If you’re thinking of investing in property in Crawley or surrounding towns, it’s well worth speaking to a property professional who can help point you in the right direction. What & where to buy will depend on your investment strategy, which may be balanced or more skewed towards either capital growth or rental income. We’re more than happy to provide you with free independent advice on any investment purchase you might be contemplating. Just pick up the phone and give us a call on 01293 515588. Alternatively, you can also drop us an e-mail to crawley@northwooduk.com. We look forward to hearing from you.

The opinions expressed in this article are those of the author only and not of 
Northwood. If you are considering investing in property you should seek 
appropriate professional advice.


20th November 2015

Horsham v’s Crawley !

Well, the Christmas Season is really starting to gather pace now. As it does you’ll usually find that the sales & lettings markets start to quieten down a bit. However, do keep your eyes peeled. There will be some bargains to be had, particularly as most people will be turning their attention towards the festive season.

One of our landlords called up the other day after reading the blog we posted on 6th November. If you re-call, in this blog we showed why the price of flats in Crawley had underperformed houses over the last 10 years. Well, the landlord concerned lives just outside of Horsham and has investment properties there, as well Crawley. He asked us if the price of his flat in Horsham had similarly underperformed the market.

When we compared average sold prices of flats in Crawley & Horsham over the last decade, Horsham clearly came out on top. As shown in the Table below, the difference in the average sold price between flats in Crawley & Horsham was barely discernible in 2005. By 2010, however, it had increased to 3.7% and over the last 5 years had widened even further to 21%. So in direct answer to our landlord’s question, his Horsham flat had probably performed much better over the last decade, outpacing Crawley by a good 20% or so.

Table: Sold Prices in Horsham & Crawley (From Land Registry)

Crawley Blog 19-11-15 Table 2

Just to round off the Horsham v’s Crawley story, we also decided to check the current average For Sale prices advertised on Rightmove for flats in both towns. These were calculated by taking a snap-shot of flats advertised on 13th November. By doing this we found the average For Sale price of Horsham flats was about £220000 and was 11% higher than Crawley, with a figure of £198000.

In contrast to the average For Sale price, however,  when we looked at  average rents being advertised on Rightmove on the same day,  we found that Crawley was ahead at £930pcm, with Horsham lagging behind at £880pcm. Using these average rents and the current average For Sale prices, we calculated rental yields for both towns. In this case, Crawley again came out on top with an average yield of 5.6%, while Horsham was 4.8%.

So it would appear that where Horsham outperforms Crawley in terms of Capital Growth, the reverse is true for Rental Yield.

As we’ve seen before, Capital Growth & Rental Yield tend to move in opposite directions. It’s therefore well worth taking the time to consider your investment strategy thoroughly. You need to decide if you’re looking to maximise you income now, or go for maximum long term capital growth and sell later on. Of course, you could also take a compromise position between the two.

Whatever your answer is to the Capital Growth v’s Rental Yield question, we’d be more than happy to have a chat with you to explore the different options available. Why not give us a call on 01293 515588 or e-mail us at crawley@northwooduk.com.

9th November 2015

4 bedroom house, Broadfield, Crawley

We don’t normally consider 4 bedroom properties as ideal for investment purposes. However, here’s an exception in Broadfield, Crawley. Marketed by agents Homes Partnership for £229950, they also quote a potential rent of £1200pcm, which we think is pretty close to the mark. Based on this rent, the gross rental yield would be an impressive 6.3%.

Readers of our blog will know that this potential yield is at the high-end of what we tend to find in Crawley. If you would like to have a look at some further details of the property, here’s the Rightmove link  http://www.rightmove.co.uk/property-for-sale/property-55273673.html

Broadfield 9-11-15jpgPlease remember that properties with higher rental yields tend to have lower long-term capital growth. The reverse is also true. So when thinking about property investment you need to consider whether rental income or capital growth are more important for you. Once you have the answer to this question, you’ll then start to have more of an idea about what type of property investment would suit you best.

If you would like to discuss the property investment options that Crawley and surrounding towns have to offer, please don’t hesitate to give us a call on 01293 515588. Alternatively, drop us an e-mail to crawley@northwooduk.com.

6th November 2015

Crawley Property Prices Over The Last 10 Years

You may recall we showed the following headline BBC News Headlines: Prices of flats rising faster than houses, says Halifax in one of our blogs last month (26th October).

When we compared the national picture with the Crawley property market, however, we showed that the opposite trend had occurred.  In Crawley, over the last 10 years, the price of houses has in fact outperformed flats. We also showed that the average price of flats & houses had diverged over the same period. Here’s the graph again, showing average prices for flats & houses in Crawley from 2005 to 2015.

Graph 1 26-10-15So the question arising from our October blog was:  what has caused house prices in Crawley to outperform flats over the last 10 years ?

To understand the answer to this question you need to consider our old friend Supply & Demand. All prices are governed, one way or another, by Supply & Demand and property prices are no exception. In order to investigate Supply & Demand issues in the Crawley property market, we have looked in detail at average property prices (from Land Registry), together with the volume of sales that have occurred.

In the first section of this blog we’ll give you an overview of our findings, so that you don’t have to wade through all the graphs & tables to understand the trends that have occurred. In the second section, we’ll discuss the analysis in further detail, together with the graphs & tables.

1.  Overview

Our analysis shows that at least part of the reason for the different capital growth rates between flats & houses in Crawley over the last decade (shown in Graph 1 above), relates to the number of new-build properties coming on to the market.

Over the so-called credit crunch years (approximately 2008 to 2012), the number of second-hand or re-sale property sales has decreased dramatically from its peak in 2007. This is the same for both flats & houses and represents a “natural” response to market conditions i.e. less demand, less sales.

The number of new-build house sales in Crawley from 2005 to 2015 represents less than 10% of the total market. It has also broadly followed a similar pattern to that seen in the second-hand (or re-sale) market, with a reduced number of sales during the credit crunch years.

In contrast to new-build houses, however, new-build flats have not followed the same drop in sales volumes. In fact, the number of new-build flats being sold during the credit crunch years was similar or higher than in 2007…… the so-called peak of the market. In addition, new-build flats from 2007 to 2012 represented more than 40% of the total number of flats sold in Crawley. New-build flats therefore appear to have been oversupplied to the Crawley property market during the credit crunch years.

In our opinion the main reason behind the oversupply of new-build flats was that a number of developers continued to develop sites in Crawley during the credit crunch period. It would have been too costly for them to have moth-balled the sites part-way through the building works.

New-build flats in Crawley from 2007 onwards therefore had to be completed & sold by the developers even when demand in the market was depressed.  In this situation, where there is more supply than demand, prices can fall or, at very least, remain subdued. In the case of the Crawley market, the sheer volume of the oversupply of new-build flats has, in our opinion, led to the drop in the average price paid for a new-build flat from £204000 in 2007 to £168500 in 2014.  As the average price of new-build flats has dropped, so there has been an adverse knock-on effect for the second-hand (or re-sale) market.

For developers this type of market is the perfect storm in which they have to finish building & selling properties while demand, due to circumstances beyond their control, falls away. Because of the sheer volume of new-build flats coming on to the market during the credit crunch years, the more the developers sold the more downard pressure on prices !

The net result of the oversupply of new-build flats to the Crawley market during the credit crunch, has resulted in lower capital growth for flats compared with houses.

2. Detailed Analysis

The following analysis has some more graphs & tables. If you’re not used to looking at this type of information, please don’t be put off. The graphs may look far more complicated than they actually are and we’ll describe them in detail to reveal the trends they represent.

Graphs 2 & 3 show the average price paid for flats & houses in Crawley from 2005 to 2014, together with the number (or volume) of actual sales. We have excluded 2015 from these graphs because the Land Registry information only goes up to August this year. There will, of course, be many more sales in the remainder of this year.

Graph 2: Crawley Houses: Average Prices & Sales Volumes

Houses Analysis 6-11-15The solid blue line in Graph 2 shows the average House price in Crawley and is the same as that shown in Graph 1. The left pointing black arrow indicates that the blue line refers to the Average Price axis to left. The dashed lines show sale volumes and these refer to the right hand Sales Volume axis, as inidicated by the black arrow that points to the right.

Now lets look at the dashed lines in Graph 2. The purple / mauve dashed line shows the total volume of house sales i.e. both new-build and re-sale. As expected, we see an increase in sales volume to 2007, followed by a rapid decrease in 2008. Sales volumes of houses in 2008 are less than half those at the peak in 2007. From 2008 onwards we see a very gradual increase in sales volume, indicating a slow recovery in demand. Over the last couple of years there has been a more rapid increase as the market starts to return to “normal”. The green & red dashed lines show the sales volumes for New-build Houses and Re-sale Houses, respectively.

Two important things to say here about the green (new-build houses) & red (re-sale houses) dashed lines. The first is that the number of new-build house sales only represents a small percentage of the total number of house sales. To better illustrate this point we show the sales volumes for both new-build (represented by the green dashed line) and re-sale (red dashed line) in Table 1 as a percentage of the overall number of house sales.

Table1: Crawley Houses: Sales Volumes 2005 to 2015

Table 1 6-11-15 blogAs can be clearly seen from Table 1, the new-build house sales volume never gets above 9% of the total house sales market. The response of house prices in the Crawley market is therefore by and large the “natural” response of supply and demand. Hence as demand dampens down during the credit crunch, so does the supply.

Let’s now consider the same situation for the sale of flats in Crawley. Graph 3 shows the average sold prices from 2005 to 2014, together with the volumes of new-build & re-sale flats.

Graph 3: Crawley Flats: Average Prices & Sales Volumes

Flats Analysis 6-11-15Two things are obvious straight away. The first is that the volume of new-build flats coming onto the market is a much higher percentage of the total Crawley market, when compared with houses. In Table 2 we also show these volumes as percentages of the total number of flats sold.

Table2: Crawley Flats: Sales Volumes 2005 to 2015

Table 2 blog 6-11-15During the credit crunch years, new-build flats remained at over 40% of the total sales volume of flats in Crawley. Even in 2012, the percentage was over 30%. Hence, because they are a higher percentage of the total number of flats sold, new-build flats will have a much greater influence on the overall average price of flats in Crawley.

The second and perhaps even more telling point is that new-build sales volumes of flats  remain at a relatively high level during the credit crunch period between 2008 to 2012. This trend is clearly seen in Graph 3 where the green dashed line of new-build flats sales volume remains high. In contrast, however, the red dashed line showing the re-sale volume, drops in direct response to the lower demand for property seen during the credit crunch.

New-build flats sales volumes therefore appear to remain artificially high and do not fall in sympathy with the reduced demand experienced during the credit crunch. In the first section of the blog we explained that the reason for this was (in our opinion) due to developers having to complete building works and then sell large numbers of new-build flats in a depressed market.

In the situation where there is more supply than demand, prices can fall or at least remain subdued. This is exactly what appears to have happened to the new-build flat prices in Crawley, as shown in Graph 4. Here we can see that although prices have more recently started to increase, the average new-build price for a flat in Crawley in 2014 (at £168500) is around 17.5% lower than at the peak in 2007 (at £204000).

Graph 4

New-build sales blog 6-11-15

In summary, therefore, we have shown that the capital growth of flats in Crawley has been adversely affected by a large oversupply of new-build flats that have came onto the market during the credit crunch years. In contrast, capital growth for houses has been much greater, principally because there has been a better match between supply and demand.

5th November 2015

1 bedroom flat, Horley

Here’s a 1 bedroom flat in Horley, on the market with estate agents James Dean at £130000. As far as rent is concerned, they say that a flat like this should achieve a figure of £750pcm, which in our opinion seems reasonable. Here’s the link to Rightmove if you would like some further details…. http://www.rightmove.co.uk/property-for-sale/property-37525584.htmlLongbridge Flat 5-11-15

Based on the agents estimate of the likely rent and an asking price of £130000, the rental yield is an impressive 6.9%.  Do remember in general, however, the higher the yield, the lower the capital growth.

If you’re an investor looking to purchase a property in Crawley or the surrounding towns such as Horley, Redhill, Reigate, Horsham & East Grinstead, don’t hesitate to give us a call on 01293 515588. We’d be more than happy to have a chat with you. Alternatively, you can also drop us an e-mail to crawley@northwooduk.com.

26th October 2015

BBC News Headlines: Prices of flats rising faster than houses, says Halifax

One of our landlords called up recently regarding an article he’d seen on the BBC News website. The headline that grabbed his attention was that capital growth in flats had out-performed houses over the last 10 years, having increased in value by 60%. As he has both flats and a house that he rents out in Crawley, he was wondering if the same trend applied to his properties. If you’re interested, here’s the link to the article on the BBC News website http://www.bbc.co.uk/news/business-34444201.

On reading the BBC article further and looking into the information it was based on, it became clear that the main reason for flats out-performing houses was due to what we term as the “London Effect”. Because of the sheer size & value of the capital’s property market, the “London Effect” often skews house price information for the whole of UK. This can make it difficult to determine trends outside of the capital, unless London prices are excluded.

The BBC News report was based on research by the Halifax. If you want to take a look at their report, here’s the link http://www.lloydsbankinggroup.com/globalassets/documents/media/press-releases/halifax/2015/150923-property-types-final.pdf. In Table 1 below we show the property prices from the Halifax report.

The Halifax data in Table 1 shows that the price of flats have indeed increased UK wide by 60%. In addition, it should not be forgotten that during this period the UK suffered from a credit crunch from 2008 onwards, which saw UK property prices plummet after their peak in 2007. The Halifax data shows that all types of property have similarly shown an increase in value over the same period, with the next highest being terraced houses (41%), then semi-detached (32%), bungalows (28%) and lastly detached houses (21%).

Table 1 26-10-15To see if the same or similar trends apply to Crawley, we looked at the change in flat & house prices using Land Registry data. The results are shown in Table 2.

Table 2 26-10-15The property price trends for flats in Crawley in Table 2 are very different from those reported in the BBC News & Halifax headlines. In contrast to the 60% UK wide increase in the price of flats over the last decade, flats in Crawley have only increased by 26%. One reason for the lower price increase is the “London Effect”, which is obviously not present here in Crawley. In fact, looking at the data in Table 2, we see that the price of flats in Crawley have in fact underperformed houses by at least 15% over the last decade.

In Graph 1 below we show how average prices for houses and flats in Crawley have changed year on year over the last decade. The effects of the double dip recession in the UK economy on prices can also be clearly seen for both types of property. One aspect that is also very clear from this graph is the divergence in prices between flats and houses from 2005 onwards. In 2005, for example, the average price paid for a house in Crawley was 49% higher than for a flat. Over the intervening years this difference has increased. In 2010, it was 73% and in the current year it has increased to 113%. The main reason for this divergence is that the price of flats in Crawley over the last decade have remained relatively subdued compared to houses. Again, this trend is clearly shown in Graph1.

Graph 1 26-10-15

So what conclusions can we draw ?

The first is that the BBC News & Halifax headlines that flats had outperformed houses over the last decade, does not apply to the Crawley market. In fact, by detailed analysis of the Land Registry sold price data, we have shown that the reverse is in fact true for Crawley.

The second conclusion is that price increases seen for flats & houses in Crawley have diverged over the last decade. Flats have performed relatively poorly with only a 26% increase in their value compared with 41% for houses.

In later blogs we will look more closely at the possible reasons to explain the relatively poor capital appreciation achieved by flats in Crawley market over the last ten years.

*Average Flat & House prices calculated from Land Registry data

23rd October 2015

1 bed flat in Broadfield, Crawley

For those investors interested in high rental yields, this 1 bedroom flat in Broadfield, Crawley has just come on to the market with agents Taylor Robinson, priced at £139950. Here’s the Rightmove link if you’re interested in taking a look http://www.rightmove.co.uk/property-for-sale/property-51455587.html. From the pictures, the flat looks to be in good order.

Broadfield Pl 23-10-15With regards to letting, we would expect a flat like this to achieve a rent of between £725pcm & £775pcm. Based on a purchase price of £139950, this would give a gross yield of between 6.2% to 6.6%. Followers of our blog will note that this is probably the highest potential gross yield we have reported to date. Do remember the “Golden Rule” of property investment, however, that when the rental yield is high, capital growth tends to be lower.

If you’re considering investing in a buy-to-let property in Crawley or surrounding towns, why not give us a call. We’re more than happy to have a chat with you about our favourite subject ! Alternatively, drop us an e-mail to crawley@northwooduk.com.

28th September 2015

Broadfield Outperforms Pound Hill !

One of our landlords popped into the office last week looking at another Buy-to-Let property deal. He was interested in a 3 bedroom house he had seen advertised in Broadfield with another agent. His other investment properties are in Pound Hill and he wanted our opinion as to the pros & cons of buying in Broadfield.

As a letting agent we have property all over Crawley (and many further afield), including a number in both Pound Hill & Broadfield. To compare the two areas for the landlord we firstly looked at the gross rental yields he could expect in an area near to the Broadfield property being considered.  We then compared this to a similar sized area in Pound Hill, where he has his other investment properties. For the purpose of the comparison we just looked at 3 bedroom houses.

You might be surprised to learn, but our analysis showed that the area we considered in Broadfield out performed the area in Pound Hill, regarding gross rental yield ! The difference was just over 2.5%, which is not inconsiderable. The average Broadfield rental yield turned out to be just shy of 7% with average rental prices of £1140 pcm. In contrast, the Pound Hill rental yield was about 4.5%, with average rental prices of about £1290 pcm. So, Broadfield outperforms Pound Hill !

Of course, when buying a rental property, gross rental yield is not the only aspect to consider. Another key criteria to property investment is to look at capital growth. When investing in rental property, some people are mainly looking for yield. They might, for example, be relying on the income from their property investment to supplement their pension. On the other hand, others may be more interested in maximising long-term capital growth, with the intention of unlocking it at some point in the future, by selling.

To complete the picture, we also looked at the capital growth achieved by properties in the Broadfield area and found that over the last 16 or so years, the average 3 bedroom house had increased in value by around 210%, giving an absolute increase in capital of about £130000. However, when we did the same analysis on the Pound Hill area, the comparable capital growth was even more impressive at around 230% i.e. 20% more than in Broadfield ! In absolute money terms, a property purchased in this area about 16 years ago would have increased in capital value by just shy of £250000 !

So there you go. Although Broadfield outperforms Pound Hill as far as gross rental yield is concerned, Pound Hill gives a significantly higher level of capital growth. When thinking about property investments you need to consider whether yield, capital growth or perhaps a combination of the two, suits your circumstances.

Whether you’re an experienced landlord looking to invest in more properties or just tentatively considering taking a first step into Buy-to-Let, why not give us call on 01293 515588 to discuss the various options available to you. Alternatively, just send us an e-mail to crawley@northwooduk.com.