Crawley Property Prices Over The Last 10 Years
You may recall we showed the following headline BBC News Headlines: Prices of flats rising faster than houses, says Halifax in one of our blogs last month (26th October).
When we compared the national picture with the Crawley property market, however, we showed that the opposite trend had occurred. In Crawley, over the last 10 years, the price of houses has in fact outperformed flats. We also showed that the average price of flats & houses had diverged over the same period. Here’s the graph again, showing average prices for flats & houses in Crawley from 2005 to 2015.
 So the question arising from our October blog was: what has caused house prices in Crawley to outperform flats over the last 10 years ?
To understand the answer to this question you need to consider our old friend Supply & Demand. All prices are governed, one way or another, by Supply & Demand and property prices are no exception. In order to investigate Supply & Demand issues in the Crawley property market, we have looked in detail at average property prices (from Land Registry), together with the volume of sales that have occurred.
In the first section of this blog we’ll give you an overview of our findings, so that you don’t have to wade through all the graphs & tables to understand the trends that have occurred. In the second section, we’ll discuss the analysis in further detail, together with the graphs & tables.
1. Overview
Our analysis shows that at least part of the reason for the different capital growth rates between flats & houses in Crawley over the last decade (shown in Graph 1 above), relates to the number of new-build properties coming on to the market.
Over the so-called credit crunch years (approximately 2008 to 2012), the number of second-hand or re-sale property sales has decreased dramatically from its peak in 2007. This is the same for both flats & houses and represents a “natural” response to market conditions i.e. less demand, less sales.
The number of new-build house sales in Crawley from 2005 to 2015 represents less than 10% of the total market. It has also broadly followed a similar pattern to that seen in the second-hand (or re-sale) market, with a reduced number of sales during the credit crunch years.
In contrast to new-build houses, however, new-build flats have not followed the same drop in sales volumes. In fact, the number of new-build flats being sold during the credit crunch years was similar or higher than in 2007…… the so-called peak of the market. In addition, new-build flats from 2007 to 2012 represented more than 40% of the total number of flats sold in Crawley. New-build flats therefore appear to have been oversupplied to the Crawley property market during the credit crunch years.
In our opinion the main reason behind the oversupply of new-build flats was that a number of developers continued to develop sites in Crawley during the credit crunch period. It would have been too costly for them to have moth-balled the sites part-way through the building works.
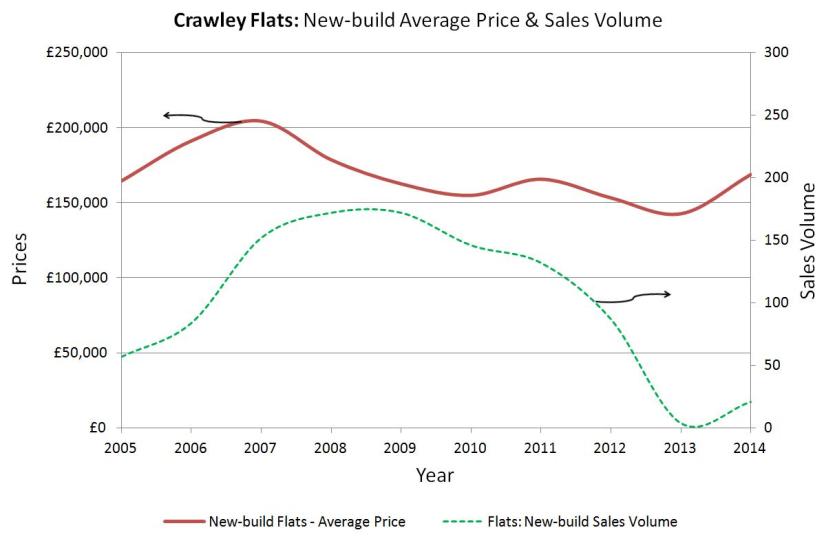
New-build flats in Crawley from 2007 onwards therefore had to be completed & sold by the developers even when demand in the market was depressed. In this situation, where there is more supply than demand, prices can fall or, at very least, remain subdued. In the case of the Crawley market, the sheer volume of the oversupply of new-build flats has, in our opinion, led to the drop in the average price paid for a new-build flat from £204000 in 2007 to £168500 in 2014. As the average price of new-build flats has dropped, so there has been an adverse knock-on effect for the second-hand (or re-sale) market.
For developers this type of market is the perfect storm in which they have to finish building & selling properties while demand, due to circumstances beyond their control, falls away. Because of the sheer volume of new-build flats coming on to the market during the credit crunch years, the more the developers sold the more downard pressure on prices !
The net result of the oversupply of new-build flats to the Crawley market during the credit crunch, has resulted in lower capital growth for flats compared with houses.
2. Detailed Analysis
The following analysis has some more graphs & tables. If you’re not used to looking at this type of information, please don’t be put off. The graphs may look far more complicated than they actually are and we’ll describe them in detail to reveal the trends they represent.
Graphs 2 & 3 show the average price paid for flats & houses in Crawley from 2005 to 2014, together with the number (or volume) of actual sales. We have excluded 2015 from these graphs because the Land Registry information only goes up to August this year. There will, of course, be many more sales in the remainder of this year.
Graph 2: Crawley Houses: Average Prices & Sales Volumes
 The solid blue line in Graph 2 shows the average House price in Crawley and is the same as that shown in Graph 1. The left pointing black arrow indicates that the blue line refers to the Average Price axis to left. The dashed lines show sale volumes and these refer to the right hand Sales Volume axis, as inidicated by the black arrow that points to the right.
Now lets look at the dashed lines in Graph 2. The purple / mauve dashed line shows the total volume of house sales i.e. both new-build and re-sale. As expected, we see an increase in sales volume to 2007, followed by a rapid decrease in 2008. Sales volumes of houses in 2008 are less than half those at the peak in 2007. From 2008 onwards we see a very gradual increase in sales volume, indicating a slow recovery in demand. Over the last couple of years there has been a more rapid increase as the market starts to return to “normal”. The green & red dashed lines show the sales volumes for New-build Houses and Re-sale Houses, respectively.
Two important things to say here about the green (new-build houses) & red (re-sale houses) dashed lines. The first is that the number of new-build house sales only represents a small percentage of the total number of house sales. To better illustrate this point we show the sales volumes for both new-build (represented by the green dashed line) and re-sale (red dashed line) in Table 1 as a percentage of the overall number of house sales.
Table1: Crawley Houses: Sales Volumes 2005 to 2015
 As can be clearly seen from Table 1, the new-build house sales volume never gets above 9% of the total house sales market. The response of house prices in the Crawley market is therefore by and large the “natural” response of supply and demand. Hence as demand dampens down during the credit crunch, so does the supply.
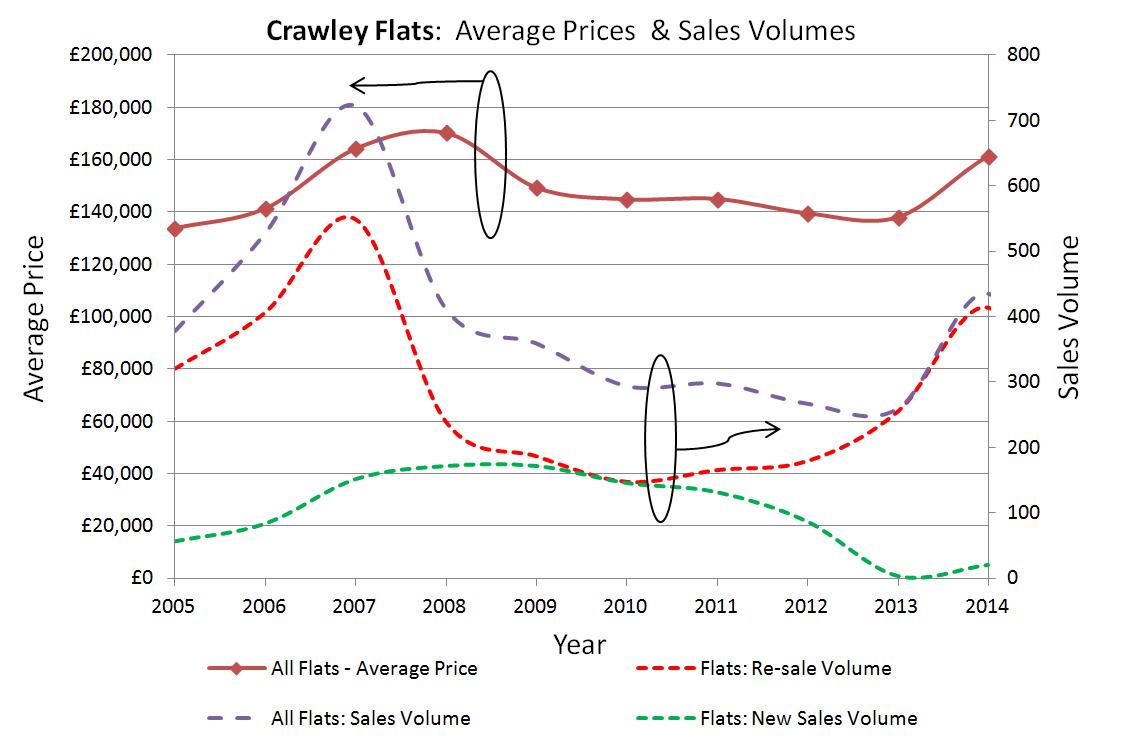
Let’s now consider the same situation for the sale of flats in Crawley. Graph 3 shows the average sold prices from 2005 to 2014, together with the volumes of new-build & re-sale flats.
Graph 3: Crawley Flats: Average Prices & Sales Volumes
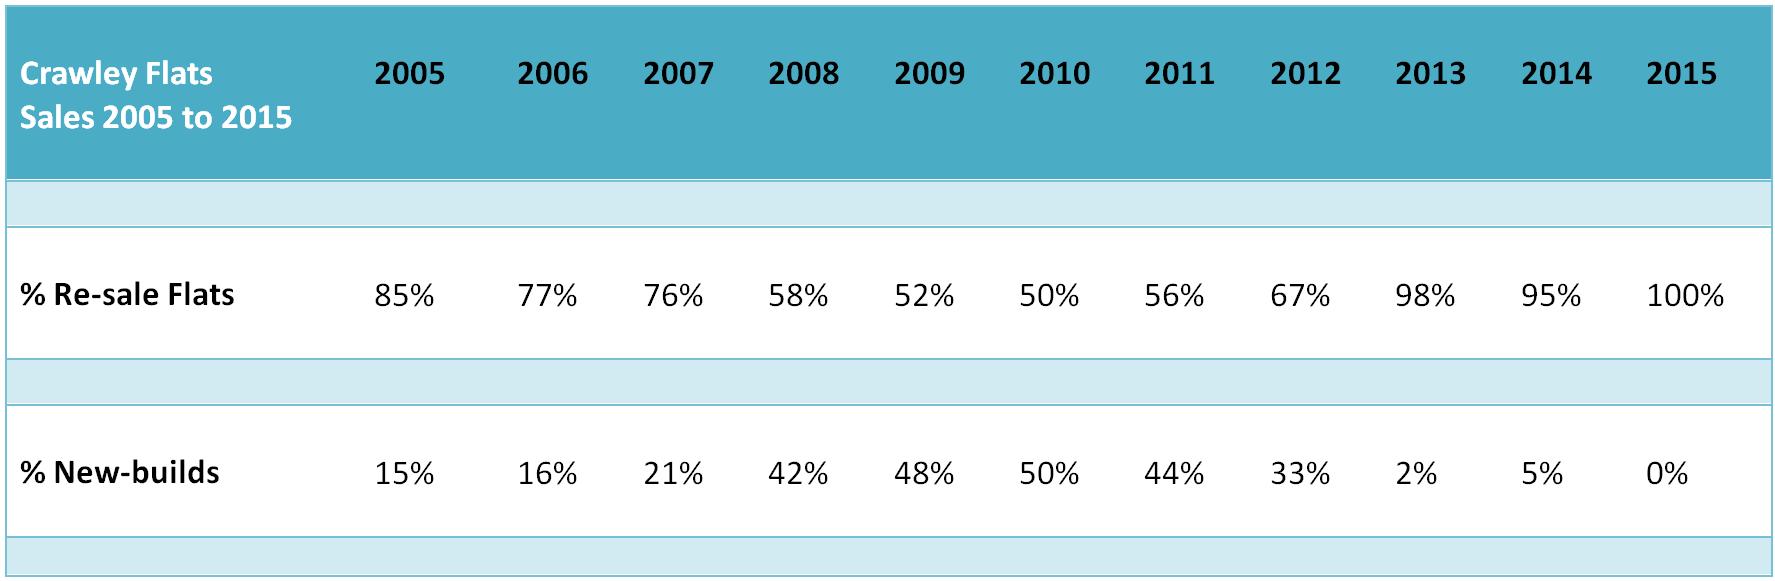
 Two things are obvious straight away. The first is that the volume of new-build flats coming onto the market is a much higher percentage of the total Crawley market, when compared with houses. In Table 2 we also show these volumes as percentages of the total number of flats sold.
Table2: Crawley Flats: Sales Volumes 2005 to 2015
 During the credit crunch years, new-build flats remained at over 40% of the total sales volume of flats in Crawley. Even in 2012, the percentage was over 30%. Hence, because they are a higher percentage of the total number of flats sold, new-build flats will have a much greater influence on the overall average price of flats in Crawley.
The second and perhaps even more telling point is that new-build sales volumes of flats remain at a relatively high level during the credit crunch period between 2008 to 2012. This trend is clearly seen in Graph 3 where the green dashed line of new-build flats sales volume remains high. In contrast, however, the red dashed line showing the re-sale volume, drops in direct response to the lower demand for property seen during the credit crunch.
New-build flats sales volumes therefore appear to remain artificially high and do not fall in sympathy with the reduced demand experienced during the credit crunch. In the first section of the blog we explained that the reason for this was (in our opinion) due to developers having to complete building works and then sell large numbers of new-build flats in a depressed market.
In the situation where there is more supply than demand, prices can fall or at least remain subdued. This is exactly what appears to have happened to the new-build flat prices in Crawley, as shown in Graph 4. Here we can see that although prices have more recently started to increase, the average new-build price for a flat in Crawley in 2014 (at £168500) is around 17.5% lower than at the peak in 2007 (at £204000).
Graph 4
In summary, therefore, we have shown that the capital growth of flats in Crawley has been adversely affected by a large oversupply of new-build flats that have came onto the market during the credit crunch years. In contrast, capital growth for houses has been much greater, principally because there has been a better match between supply and demand.