Here’s wishing you a Happy & Prosperous 2016.
Just before the Christmas break one of our long standing landlords popped into the office to wish us the Seasons Best and we got talking about what the Crawley property market has in store for the coming year. There are numerous changes afoot in the property market in general and in particular for the private rented sector (PRS). However, as we were just collecting information together for this article we were able to take a brief look at what the market here in Crawley had done in 2015. Here’s the bones of what we discussed.
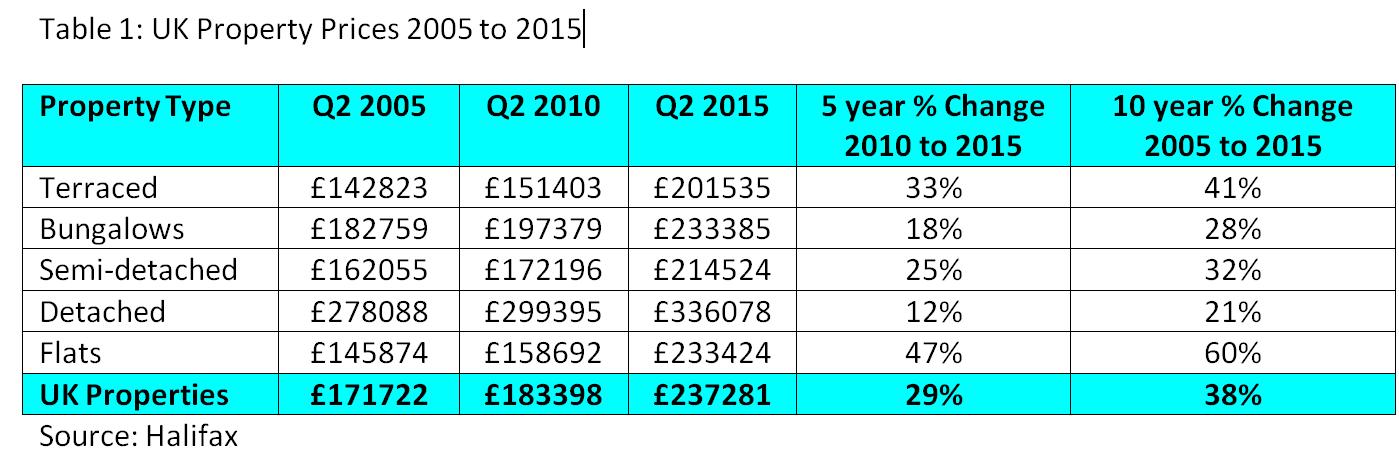
When our landlord came into the office the Nationwide Building Society had just published their December 2015 House Price Index (see http://www.nationwide.co.uk/about/house-price-index/headlines). The index had shown a steady annual increase in average property prices of 3.7% to the year ended Nov 15. This puts the average price for a property in the UK at just over £196 000 compared with just over £189000 a year earlier – see Table 1 for details. As always there is considerable regional variation in prices, with London & the Southeast coming out on top, with areas to the North & in Scotland lagging some way behind. Indeed, the Nationwide survey shows that the so-called North – South divide is alive and kicking (at least in terms of property prices) and has actually widened further. More on this later.
So much for the national picture, what about our local property market here in Crawley ?
In order to compare national trends with those in Crawley, we’ve used Land Registry price paid data and calculated the average change in local property prices. As the latest property price information from the Land Registry is up to the end of Nov 15, we’ve used this date to compare local and national trends. The information comparing Crawley and UK wide property prices is shown in Table 1 for the years ending Nov 13, 14 & 15.
Table 1
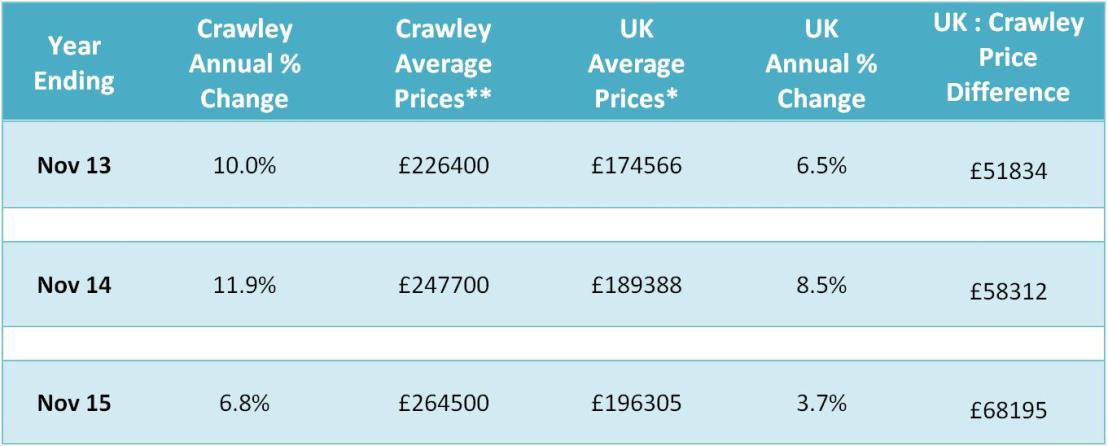
* Price data from Nationwide Building Society
** Calculated as 3 month moving averages from HM Land Registry Price Paid Data to the nearest £100
As you can see from Table 1, the average Crawley property price in Nov 15 was £264500. This is some 35% above the national average as quoted by the Nationwide at £196305. The difference between these prices is only to be expected for a town like Crawley which lies in the South East of England, one of the most expensive parts of the UK. The table also shows the year on year rate of property prices rises, which are also shown on Graph 1.
Slowing Rate of Property Prices Rises
As we are all no doubt aware, prices in Crawley have been increasing over the last few years. However, as shown in Graph 1, the rate of increase has slowed to 6.8% for the year ended Nov 15 from a peak in 2014. The trend of year on year property price rises seen in Crawley over the last few years is mirrored nationally, but at a lower rate – as shown in Graph 1.
Graph 1

The reduction in property price rises shown in Graph 1 is not unexpected, as wage rises have increased at a much lower rate. In addition, the Government, via the Bank of England, has tried to clamp down on the availability of mortgages and imposed much stricter lending criteria in the so-called MMR (Mortgage Market Review). More recently, the Bank of England has also announced a tightening on Buy-to-Let lending, in an effort to limit property prices rises to a more sustainable long term level. So the slowdown in the rate of property price rises is to be expected and is largely welcome – after all, no one really wants another boom & bust ! Let’s hope the politicians and the Bank of England know what they’re doing !
Increasing North – South Divide
Both Graph & Table 1 also show another interesting trend in property prices – the so-called North – South divide. As clearly seen in Graph 1, the rate of property price increases in Crawley (blue line) has been consistently higher compared with the national trend (red line). Prices in Crawley have therefore been increasing at a faster rate than those nationally.
The difference in average prices between Crawley and the rest of the UK is shown in more detail in Graph 2. Again, the blue line shows Crawley prices and the red line, the UK average. You will notice that the price data for Crawley is more “lumpy” than that seen nationally from the Nationwide. This is due to the relative amounts of data used to produce the two graphs. Nonetheless, the upward trend in property prices in both cases is obvious to see. Trendlines have also been added to the graphs (the dark grey dashed lines) for clarity.
Graph 2 Firstly notice that the trendlines are good fits to both sets of data. Secondly, it can be seen quite clearly that the trendline for Crawley has a steeper slope than that for the UK as a whole. This indicates the more rapid rise of property prices here in Crawley. By way of example, in Nov 13 the difference in average prices between Crawley and the rest of the UK was just under £52000. Fast forward to the end of Nov 15, however, and the difference had increased by nearly 32% to just over £68000. So, the North – South divide in property prices continues to widen.
Well, so much for what has happened to the Crawley property market in 2015, what about 2016 ? Over the next few blogs we’ll take a more detailed look at what could lay in store for us in the coming year. We’ll also take a more detailed look at some interesting properties as they come on to the market.
If you’re interested in property investment in Crawley or the surrounding towns, why not give us call on 01293 515588. Our advice is free and we’d love to have a chat with you about our favourite subject – property ! Alternatively, you can also e-mail us on crawley@northwooduk.com. Either way, we’d love to hear from you.